这段时间一直比较忙,答应帮朋友完善的一个RCP毕业设计,直到这两天才有时间动手。这个RCP有生成报表的需求,首先想到的是JFreeChart和BIRT的Chart引擎。因为对JFreeChart比较熟悉,就选择用它做报表。
ChartView.java创建一个View类,这里JFreeChart报表参考了SWTTimeSeriesDemo,当然之前得首先加入jfreechart-1.0.5.jar、jfreechart-1.0.5-swt.jar和jcommon1.0.9.jar。

 /** *//**
 * @author zyh2k
*
 */
*/
public class ChartView extends ViewPart  {
{
private ChartComposite frame;

 /**//* (non-Javadoc)
* @see org.eclipse.ui.part.WorkbenchPart#createPartControl(org.eclipse.swt.widgets.Composite)
 */
*/
@Override
public void createPartControl(Composite parent) {
// TODO Auto-generated method stub
final JFreeChart chart = createChart(createDataset());
/**//*final Display display = new Display();
Shell shell = new Shell(display);
shell.setSize(600, 300);
shell.setLayout(new FillLayout());
shell.setText("Time series demo for jfreechart running with SWT");*/
frame = new ChartComposite(parent, SWT.NONE, chart, true);
FillLayout fillLayout = new FillLayout();
fillLayout.type = SWT.VERTICAL;
frame.setLayout(fillLayout);
frame.setSize(600, 300);
frame.setDisplayToolTips(true);
frame.setHorizontalAxisTrace(false);
frame.setVerticalAxisTrace(false);
/**//*shell.open();
while (!shell.isDisposed()) {
if (!display.readAndDispatch())
display.sleep();
}*/
}
/** *//**
* 用户退出时,将面板隐藏
*/
public void logoff() {
if (frame != null && !frame.isDisposed())
frame.setVisible(false);
}
/** *//**
* 显示面板内容
*/
public void show() {
if (frame != null && !frame.isDisposed())
frame.setVisible(true);
}
/**//* (non-Javadoc)
* @see org.eclipse.ui.part.WorkbenchPart#setFocus()
*/
@Override
public void setFocus() {
// TODO Auto-generated method stub
}
/** *//**
* Creates a chart.
*
* @param dataset a dataset.
*
* @return A chart.
*/
private static JFreeChart createChart(XYDataset dataset) {
JFreeChart chart = ChartFactory.createTimeSeriesChart(
"宿舍水电费月报表", // title
"日期", // x-axis label
"费用", // y-axis label
dataset, // data
true, // create legend?
true, // generate tooltips?
false // generate URLs?
);
chart.setBackgroundPaint(Color.white);
XYPlot plot = (XYPlot) chart.getPlot();
plot.setBackgroundPaint(Color.lightGray);
plot.setDomainGridlinePaint(Color.white);
plot.setRangeGridlinePaint(Color.white);
plot.setAxisOffset(new RectangleInsets(5.0, 5.0, 5.0, 5.0));
plot.setDomainCrosshairVisible(true);
plot.setRangeCrosshairVisible(true);
XYItemRenderer r = plot.getRenderer();
if (r instanceof XYLineAndShapeRenderer) {
XYLineAndShapeRenderer renderer = (XYLineAndShapeRenderer) r;
renderer.setBaseShapesVisible(true);
renderer.setBaseShapesFilled(true);
}
DateAxis axis = (DateAxis) plot.getDomainAxis();
axis.setDateFormatOverride(new SimpleDateFormat("MMM-yyyy"));
return chart;
}
/** *//**
* Creates a dataset, consisting of two series of monthly data.
*
* @return The dataset.
*/
private static XYDataset createDataset() {
TimeSeriesCollection dataset = new TimeSeriesCollection();
DbOperate db = DwesFactory.getDbOperate();
List rooms = db.getRoomAll();
List datas = db.getScoreAll();
for (Iterator iter = rooms.iterator(); iter.hasNext();) {
String room = (String) iter.next();
TimeSeries roomSeries = new TimeSeries(room, Month.class);
for (Iterator dataIter = datas.iterator(); dataIter.hasNext();) {
Score score = (Score) dataIter.next();
if(score.getName().equals(room)) {
int[] dataObj = DateUtils.getNowSingleObject(score.getMonth());
roomSeries.add(new Month(dataObj[1], dataObj[2]), score.getScore());
}
}
dataset.addSeries(roomSeries);
}
return dataset;
}
}NavigatorView.java调用ChartView
/** *//**
* 结点双击事件
*/
private class MyDoubleClickListener implements IDoubleClickListener {
public void doubleClick(DoubleClickEvent event) {
IStructuredSelection sel = (IStructuredSelection) event.getSelection();
NavigatorEntry entry = (NavigatorEntry) sel.getFirstElement();
// 取得IWorkbenchPage
IWorkbenchPage workbenchPage = getViewSite().getPage();
if(entry.getName().equals("报表输出")){
String viewId = ChartView.class.getName();
ChartView view;
try {
view = (ChartView) workbenchPage.showView(viewId);
view.show();//显示面板内容
} catch (PartInitException e) {
// TODO Auto-generated catch block
e.printStackTrace();
}
} else {
IEditorInput editorInput = entry.getEditorInput();
String editorID = entry.getEditorId();
// 如果editorInput或editorID为空则中断返回
if (editorInput == null || editorID == null)
return;
//搜索使用editorInput对象对应的编辑器
IEditorPart editor = workbenchPage.findEditor(editorInput);
// 如果此编辑器已经存在,则将它设为当前编辑器,否则重新打开一个编辑器。
if (editor != null) {
workbenchPage.bringToTop(editor);
} else {
try {
editor = workbenchPage.openEditor(editorInput, editorID);
} catch (PartInitException e2) {
e2.printStackTrace();
}
}
}
}
}
plugin.xml
 <!-- 加入视图 -->
<view
name="报表视图"
icon="icons/project.gif"
category="cn.com.wen.dwes.view"
class="cn.com.wen.dwes.archive.ChartView"
id="cn.com.wen.dwes.archive.ChartView">
</view>
</extension>
MANIFEST.MF加入引用的包
Bundle-ClassPath: dwes.jar,
lib/mysql-connector-java-5.0.3-bin.jar,
lib/jcommon-1.0.9.jar,
lib/jfreechart-1.0.5.jar,
lib/jfreechart-1.0.5-swt.jar
运行的效果
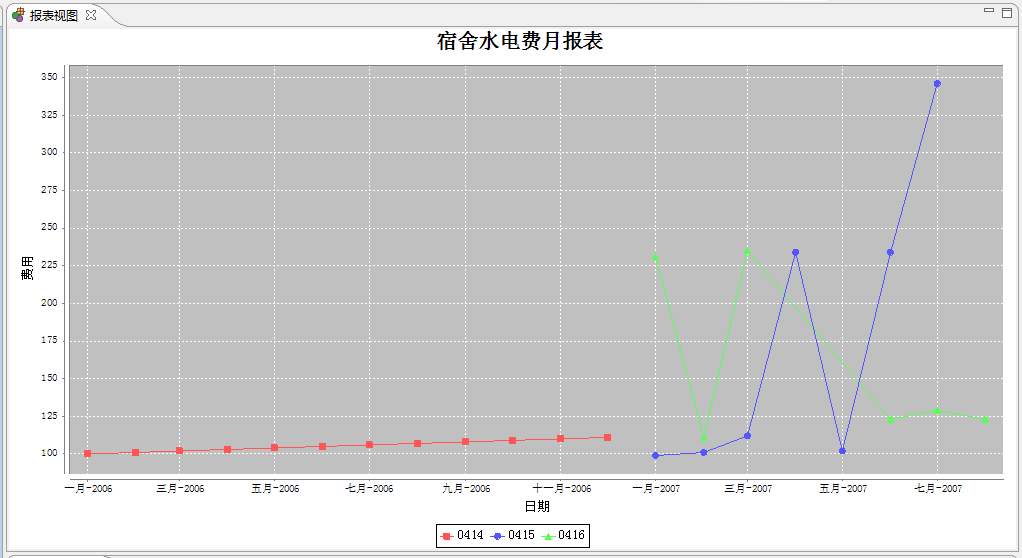
运行时把鼠标可以报表上左右拖动或选择一个区域放大,有点像BIRO报表的向下钻取。由于SWT的JFreeChart目前还是experimental,想把它运用在商业化项目的朋友慎重考虑。
posted on 2007-06-07 10:03
冻僵的鱼 阅读(3236)
评论(1) 编辑 收藏